LLM & Agents
Argus
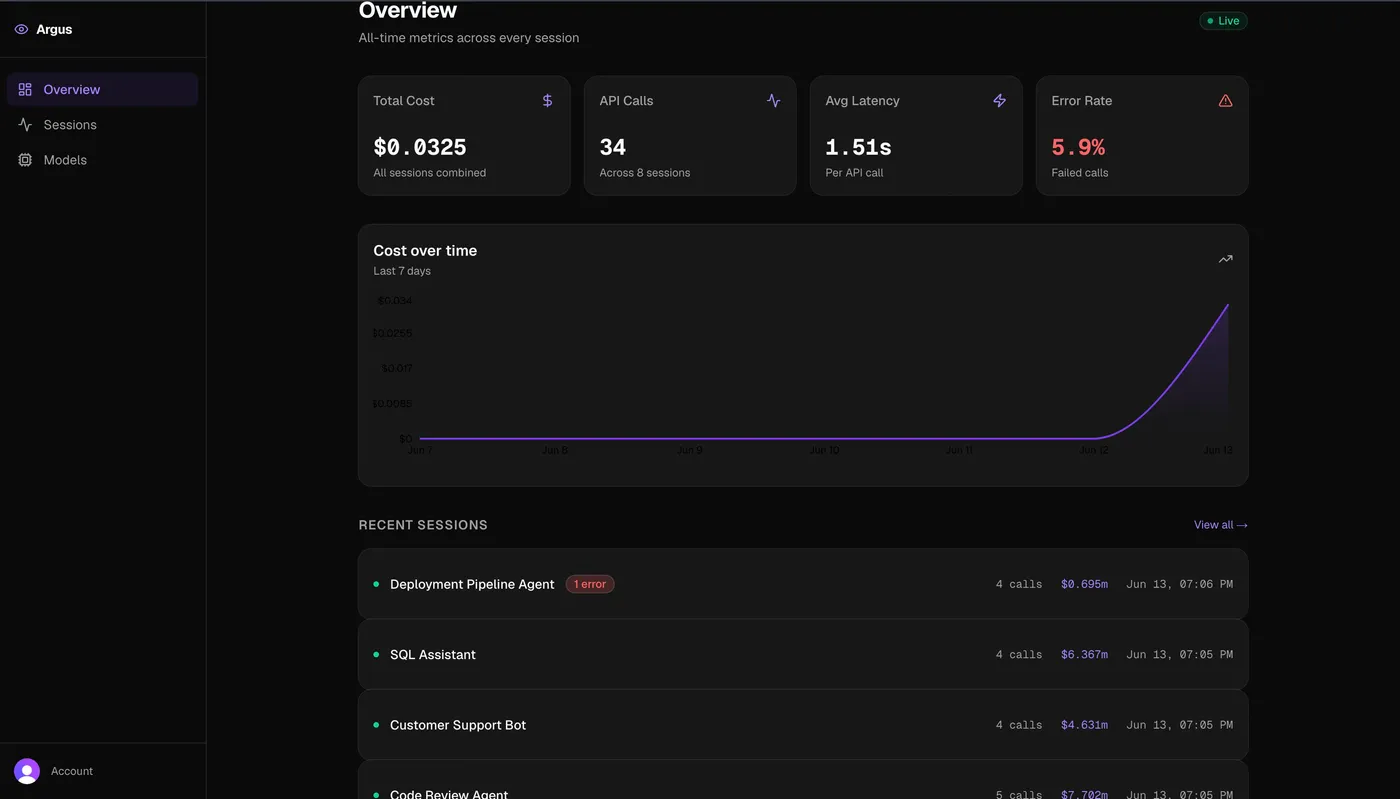
A wrapper for the raw Anthropic SDK that logs every tool call, cost, and error, with a live dashboard for multi turn agent sessions. One caching fix cut token cost 86%.
The problem
Anyone building AI agents on the raw Anthropic SDK hits the same blind spot: once an agent is running in production, it is hard to see what it is doing, what each session actually costs, or why a call failed. Generic tools like Grafana and Sentry were not built for multi turn agent traces, and the AI native tools mostly assume you are on LangChain. If you call the SDK directly, you are flying blind, and unmonitored token spend is the kind of cost that quietly balloons before anyone notices.
What I built
- Wrote a thin wrapper around the Anthropic SDK that drops in for the normal client with no code rewrite, capturing every tool call: input and output tokens, latency, whether it succeeded, and the arguments passed.
- Rolled cost up per session, so you can answer what an entire conversation cost across every call instead of guessing from single requests.
- Streamed traces to a live dashboard over server sent events, backed by FastAPI, PostgreSQL and Redis, and made the whole stack run locally with one Docker Compose command.
- Classified errors by tool and latency, so a failed call shows what it cost and exactly where it broke.
The outcome
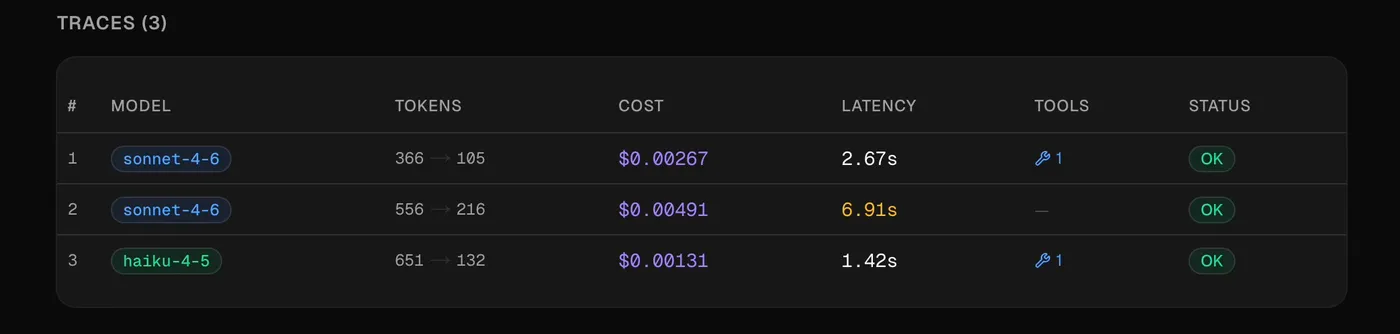
Running Argus against my own agents, I found the system prompt was being resent on every turn. One caching change cut token cost by 86%, from 2,693 tokens to 366. That is the whole point of the tool: you cannot cut a cost you cannot see.
Stack
- Next.js
- FastAPI
- PostgreSQL
- Redis
- SSE
- Docker