ML & Data
EnergyFlareIQ
Province wide flare and vent intelligence over Petrinex data. Scores anomalies against AER Directive 060 with an isolation forest and maps every operator in Alberta.
The problem
Alberta publishes flaring and venting volumes for every facility in the province, but the data sits in dozens of monthly Petrinex files that almost nobody opens. So the people who should be able to answer simple questions, who is flaring the most, where are the anomalies, is methane going up or down, cannot answer them without serious data work. Flared and vented gas is wasted product and a climate and regulatory liability, and you cannot manage what you cannot see across a whole province.
What I built
- Built an ETL pipeline that parses 53 monthly Petrinex files into 782,897 facility months of clean, queryable records.
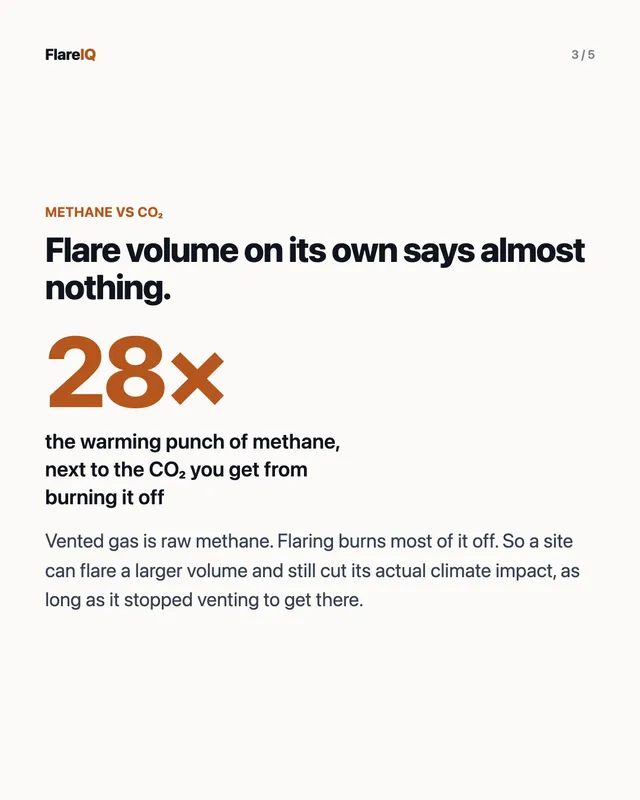
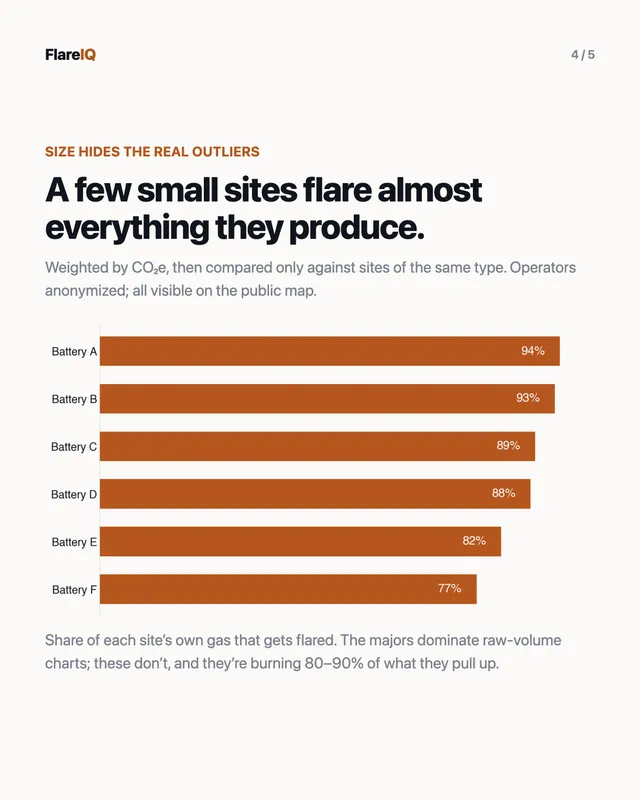
- Scored anomalies three ways: against AER Directive 060 thresholds, with a methane weighted CO2e number so venting is not treated the same as flaring, and with an isolation forest plus temporal spike detection to catch cases a fixed threshold misses.
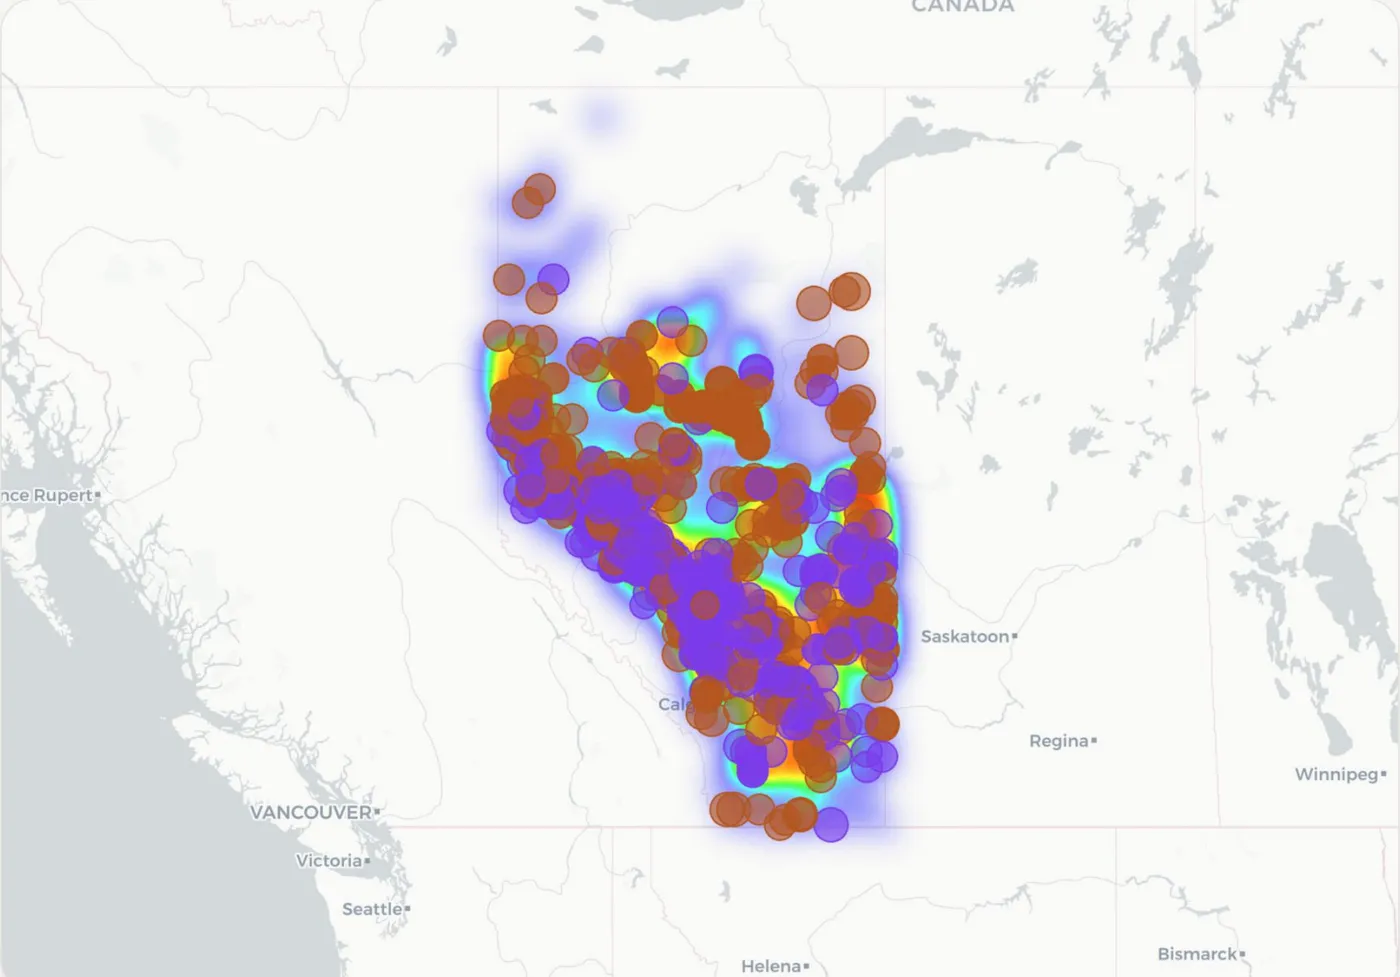
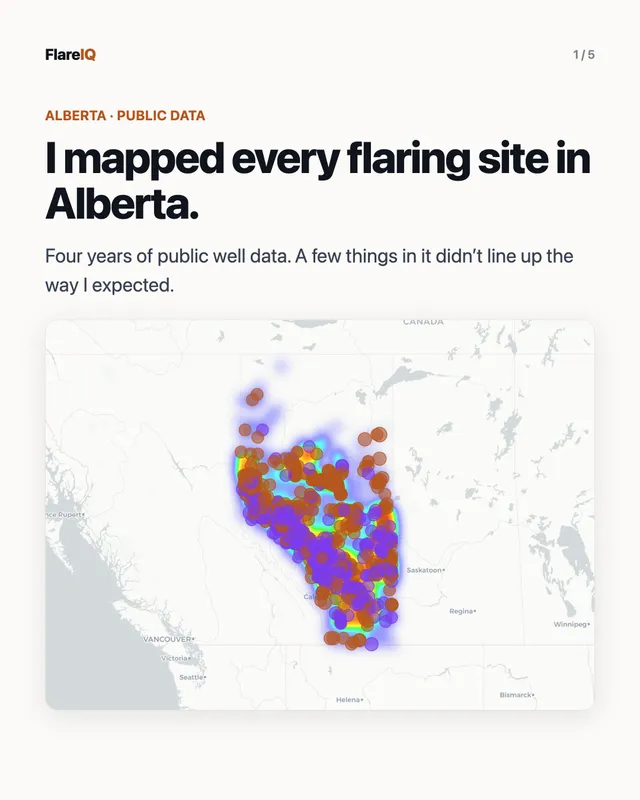
- Converted Alberta Township System land descriptions into latitude and longitude so every facility could be placed on a map.
- Rendered the whole province as an interactive Next.js and Leaflet map, so an operator or a regulator can find any site and see its history.
The outcome
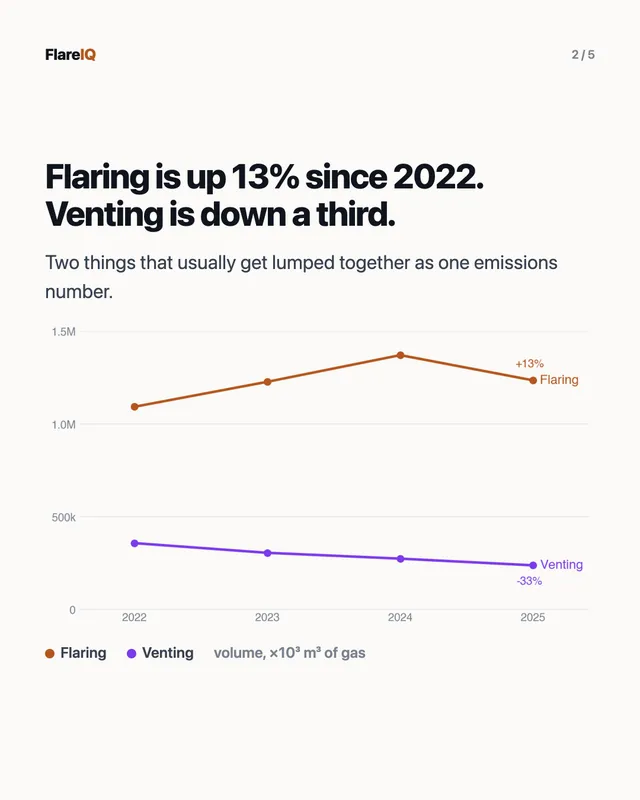
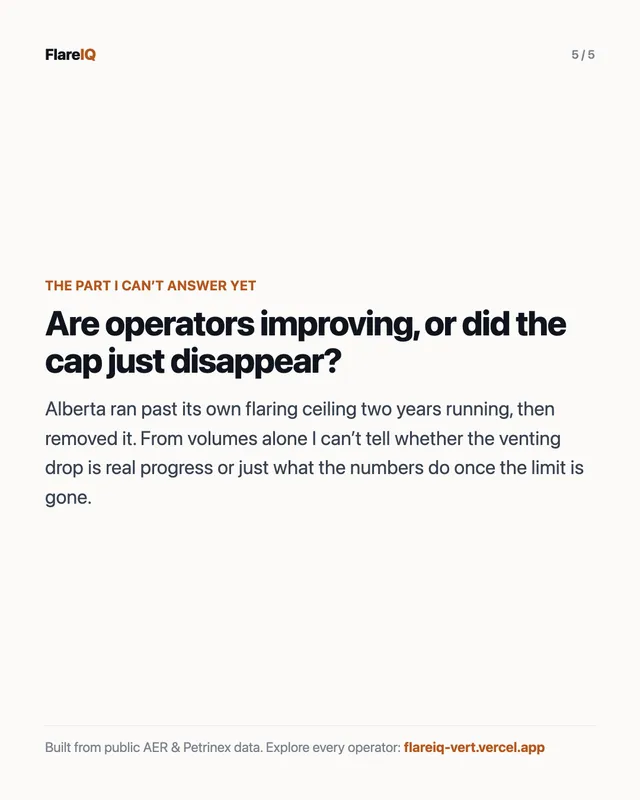
The data showed flaring up about 13% and venting down about 33% since 2022, which lines up with the shift in methane policy. More to the point, anyone can now open the map and read the province at a glance instead of parsing raw government files.
The data story
Stack
- Python
- Isolation Forest
- Next.js
- Leaflet
- ETL